Machine Learning Q and AI
30 Essential Questions and Answers on Machine Learning and AI
By Sebastian Raschka. Free to read.
Published by No Starch Press.
Copyright © 2024-2025 by Sebastian Raschka.

Machine learning and AI are moving at a rapid pace. Researchers and practitioners are constantly struggling to keep up with the breadth of concepts and techniques. This book provides bite-sized bits of knowledge for your journey from machine learning beginner to expert, covering topics from various machine learning areas. Even experienced machine learning researchers and practitioners will encounter something new that they can add to their arsenal of techniques.
📘 Print Book:
Amazon
No Starch Press
📄 Read Online:
Full Book (Free)
Chapter 26: Confidence Intervals vs. Conformal Predictions
What are the differences between confidence intervals and conformal predictions, and when do we use one over the other?
Confidence intervals and conformal predictions are both statistical methods to estimate the range of plausible values for an unknown population parameter. As discussed in Chapter [ch25], a confidence interval quantifies the level of confidence that a population parameter lies within an interval. For instance, a 95 percent confidence interval for the mean of a population means that if we were to take many samples from the population and calculate the 95 percent confidence interval for each sample, we would expect the true population mean (average) to lie within these intervals 95 percent of the time. Chapter [ch25] covered several techniques for applying this method to estimate the prediction performance of machine learning models. Conformal predictions, on the other hand, are commonly used for creating prediction intervals, which are designed to cover a true outcome with a certain probability.
This chapter briefly explains what a prediction interval is and how it differs from confidence intervals, and then it explains how conformal predictions are, loosely speaking, a method for constructing prediction intervals.
Confidence Intervals and Prediction Intervals
Whereas a confidence interval focuses on parameters that characterize a population as a whole, a prediction interval provides a range of values for a single predicted target value. For example, consider the problem of predicting people’s heights. Given a sample of 10,000 people from the population, we might conclude that the mean (average) height is 5 feet, 7 inches. We might also calculate a 95 percent confidence interval for this mean, ranging from 5 feet, 6 inches to 5 feet, 8 inches.
A prediction interval, however, is concerned with estimating not the height of the population but the height of an individual person. For example, given a weight of 185 pounds, a given person’s prediction interval may fall between 5 feet 8 inches and 6 feet.
In a machine learning model context, we can use confidence intervals to estimate a population parameter such as the accuracy of a model (which refers to the performance on all possible prediction scenarios). In contrast, a prediction interval estimates the range of output values for a single given input example.
Prediction Intervals and Conformal Predictions
Both conformal predictions and prediction intervals are statistical techniques that estimate uncertainty for individual model predictions, but they do so in different ways and under different assumptions.
While prediction intervals often assume a particular data distribution and are tied to a specific type of model, conformal prediction methods are distribution free and can be applied to any machine learning algorithm.
In short, we can think of conformal predictions as a more flexible and generalizable form of prediction intervals. However, conformal predictions often require more computational resources than traditional methods for constructing prediction intervals, which involve resampling or permutation techniques.
Prediction Regions, Intervals, and Sets
In the context of conformal prediction, the terms prediction interval, prediction set, and prediction region are used to denote the plausible outputs for a given instance. The type of term used depends on the nature of the task.
In regression tasks where the output is a continuous variable, a prediction interval provides a range within which the true value is expected to fall with a certain level of confidence. For example, a model might predict that the price of a house is between $200,000 and $250,000.
In classification tasks, where the output is a discrete variable (the class labels), a prediction set includes all class labels that are considered plausible predictions for a given instance. For example, a model might predict that an image depicts either a cat, dog, or bird.
Prediction region is a more general term that can refer to either a prediction interval or a prediction set. It describes the set of outputs considered plausible by the model.
Computing Conformal Predictions
Now that we’ve introduced the difference between confidence intervals and prediction regions and learned how conformal prediction methods are related to prediction intervals, how exactly do conformal predictions work?
In short, conformal prediction methods provide a framework for creating prediction regions, sets of potential outcomes for a prediction task. Given the assumptions and methods used to construct them, these regions are designed to contain the true outcome with a certain probability.
For classifiers, a prediction region for a given input is a set of labels such that the set contains the true label with a given confidence (typically 95 percent), as illustrated in Figure 1.1.
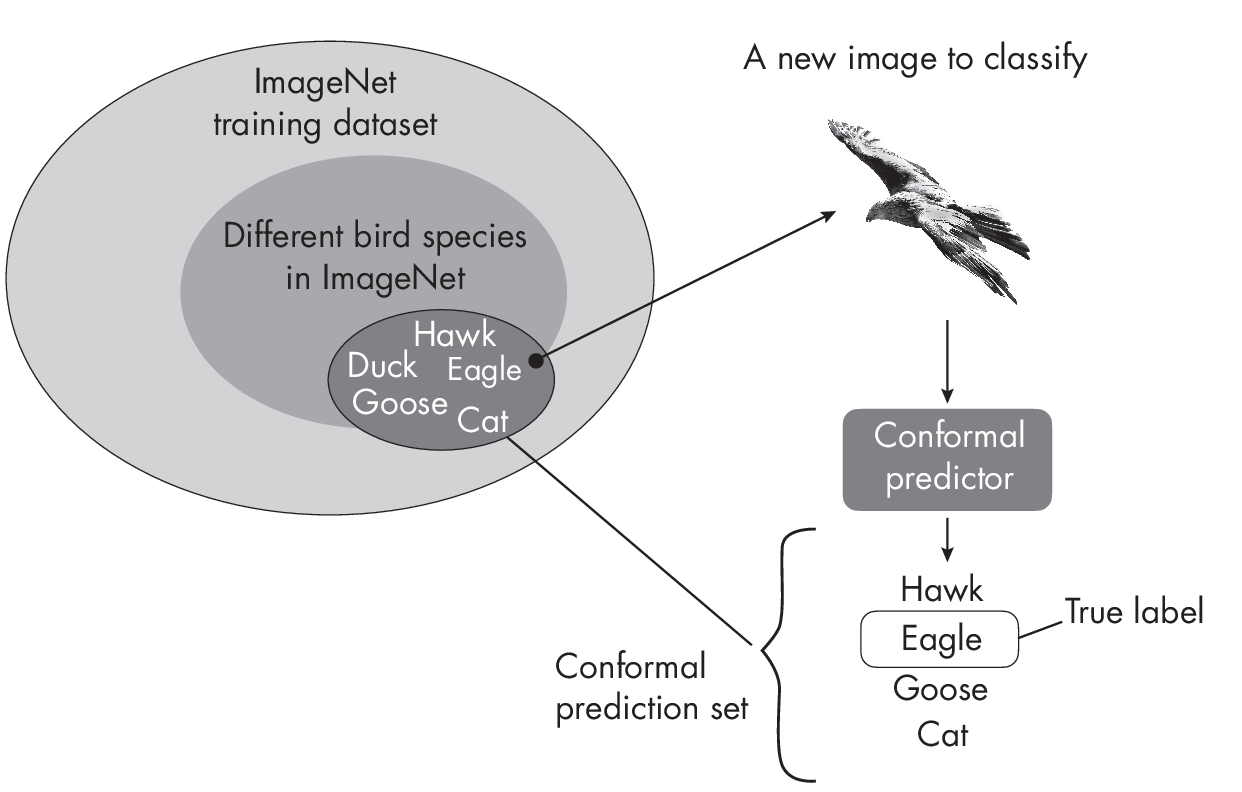
As depicted in Figure 1.1, the ImageNet dataset consists of a subset of bird species. Some bird species in ImageNet belong to one of the follow- ing classes: hawk, duck, eagle, or goose. ImageNet also contains other animals, for example, cats. For a new image to classify (here, an eagle), the conformal prediction set consists of classes such that the true label, eagle, is contained within this set with 95 percent probability. Often, this includes closely related classes, such as hawk and goose in this case. However, the prediction set can also include less closely related class labels, such as cat.
To sketch the concept of computing prediction regions step by step, let’s suppose we train a machine learning classifier for images. Before the modelis trained, the dataset is typically split into three parts: a training set, a calibration set, and a test set. We use the training set to train the model and the calibration set to obtain the parameters for the conformal prediction regions. We can then use the test set to assess the performance of the conformal predictor. A typical split ratio might be 60 percent training data, 20 percent calibration data, and 20 percent test data.
The first step after training the model on the training set is to define a nonconformity measure, a function that assigns a numeric score to each instance in the calibration set based on how “unusual” it is. This could be based on the distance to the classifier’s decision boundary or, more commonly, 1 minus the predicted probability of a class label. The higher the score is, the more unusual the instance is.
Before using conformal predictions for new data points, we use the nonconformity scores from the calibration set to compute a quantile threshold. This threshold is a probability level such that, for example, 95 percent of the instances in the calibration set (if we choose a 95 percent confidence level) have nonconformity scores below this threshold. This threshold is then used to determine the prediction regions for new instances, ensuring that the predictions are calibrated to the desired confidence level.
Once we have the threshold value, we can compute prediction regions for new data. Here, for each possible class label (each possible output of your classifier) for a given instance, we check whether its nonconformity score is below the threshold. If it is, then we include it in the prediction set for that instance.
A Conformal Prediction Example
Let’s illustrate this process of making conformal predictions with an example using a simple conformal prediction method known as the score method. Suppose we train a classifier on a training set to distinguish between three species of birds: sparrows, robins, and hawks. Suppose the predicted probabilities for a calibration dataset are as follows:
Sparrow [0.95, 0.9, 0.85, 0.8, 0.75]
Robin [0.7, 0.65, 0.6, 0.55, 0.5]
Hawk [0.4, 0.35, 0.3, 0.25, 0.2]
As depicted here, we have a calibration set consisting of 15 examples, five for each of the three classes. Note that a classifier returns three probability scores for each training example: one probability corresponding to each of the three classes (Sparrow, Robin, and Hawk). Here, however, we’ve selected only the probability for the true class label. For example, we may obtain the values [0.95, 0.02, 0.03] for the first calibration example with the true label Sparrow. In this case, we kept only 0.95.
Next, after we obtain the previous probability scores, we can compute the nonconformity score as 1 minus the probability, as follows:
Sparrow [0.05, 0.1, 0.15, 0.2, 0.25]
Robin [0.3, 0.35, 0.4, 0.45, 0.5]
Hawk [0.6, 0.65, 0.7, 0.75, 0.8]
Considering a confidence level of 0.95, we now select a threshold such that 95 percent of these nonconformity scores fall below that threshold. Based on the nonconformity scores in this example, this threshold is 0.8. We can then use this threshold to construct the prediction sets for new instances we want to classify.
Now suppose we have a new instance (a new image of a bird) that we want to classify. We calculate the nonconformity score of this new bird image, assuming it belongs to each bird species (class label) in the training set:
Sparrow 0.26
Robin 0.45
Hawk 0.9
In this case, the Sparrow and Robin nonconformity scores fall below the threshold of 0.8. Thus, the prediction set for this input is [Sparrow, Robin]. In other words, this tells us that, on average, the true class label is included in the prediction set 95 percent of the time.
A hands-on code example implementing the score method can be found in the supplementary/q26_conformal-prediction subfolder at https://github.com/rasbt/MachineLearning-QandAI-book.
The Benefits of Conformal Predictions
In contrast to using class-membership probabilities returned from classifiers, the major benefits of conformal prediction are its theoretical guarantees and its generality. Conformal prediction methods don’t make any strong assumptions about the distribution of the data or the model being used, and they can be applied in conjunction with any existing machine learning algorithm to provide confidence measures for predictions.
Confidence intervals have asymptotic coverage guarantees, which means that the coverage guarantee holds in the limit as the sample (test set) size goes to infinity. This doesn’t necessarily mean that confidence intervals work for only very large sample sizes, but rather that their properties are more firmly guaranteed as the sample size increases. Confidence intervals therefore rely on asymptotic properties, meaning that their guarantees become more robust as the sample size grows.
In contrast, conformal predictions provide finite-sample guarantees, ensuring that the coverage probability is achieved for any sample size. For example, if we specify a 95 percent confidence level for a conformal prediction method and generate 100 calibration sets with corresponding prediction sets, the method will include the true class label for 95 out of the 100 test points. This holds regardless of the size of the calibration sets.
While conformal prediction has many advantages, it does not always provide the tightest possible prediction intervals. Sometimes, if the underlying assumptions of a specific classifier hold, that classifier’s own probability estimates might offer tighter and more informative intervals.
Recommendations
A confidence interval tells us about our level of uncertainty about the model’s properties, such as the prediction accuracy of a classifier. A prediction interval or conformal prediction output tells us about the level of uncertainty in a specific prediction from the model. Both are very important in understanding the reliability and performance of our model, but they provide different types of information.
For example, a confidence interval for the prediction accuracy of a model can be helpful for comparing and evaluating models and for deciding which model to deploy. On the other hand, a prediction interval can be helpful for using a model in practice and understanding its predictions. For instance, it can help identify cases where the model is unsure and may need additional data, human oversight, or a different approach.
Exercises
26-1. Prediction set sizes can vary between instances. For example, we may encounter a prediction set size of 1 for a given instance and for another, a set size of 3. What does the prediction set size tell us?
26-2. Chapters [ch25] and [ch26] focused on classification methods. Could we use conformal prediction and confidence intervals for regression too?
References
-
MAPIE is a popular library for conformal predictions in Python: https://mapie.readthedocs.io/.
-
For more on the score method used in this chapter: Christoph Molnar, Introduction to Conformal Prediction with Python (2023), https://christophmolnar.com/books/conformal-prediction/.
-
In addition to the score method, several other variants of confor- mal prediction methods exist. For a comprehensive collection of conformal prediction literature and resources, see the Awesome Conformal Prediction page: https://github.com/valeman/awesome-conformal-prediction.
Support the Author
You can support the author in the following ways:
- Subscribe to Sebastian's Substack blog
- Purchase a copy on Amazon or No Starch Press
- Write an Amazon review